In Zappyhire’s work with CHROs and talent leaders, we see a common thread – decisions improve dramatically when they’re grounded in metrics. You might think “well, duh” but this gets overlooked more often than you think.
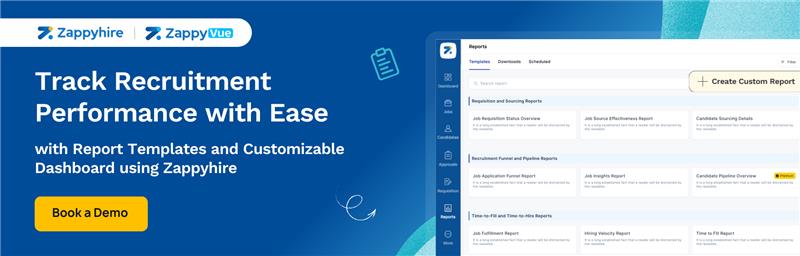
The right recruitment reports act like a dashboard for your recruiting engine showing where the process hums and where it stutters.
Below is a deep dive into the essential recruitment reports every enterprise-level talent acquisition team should master.
9 Recruitment Reports You Must Have to Track Hiring Performance
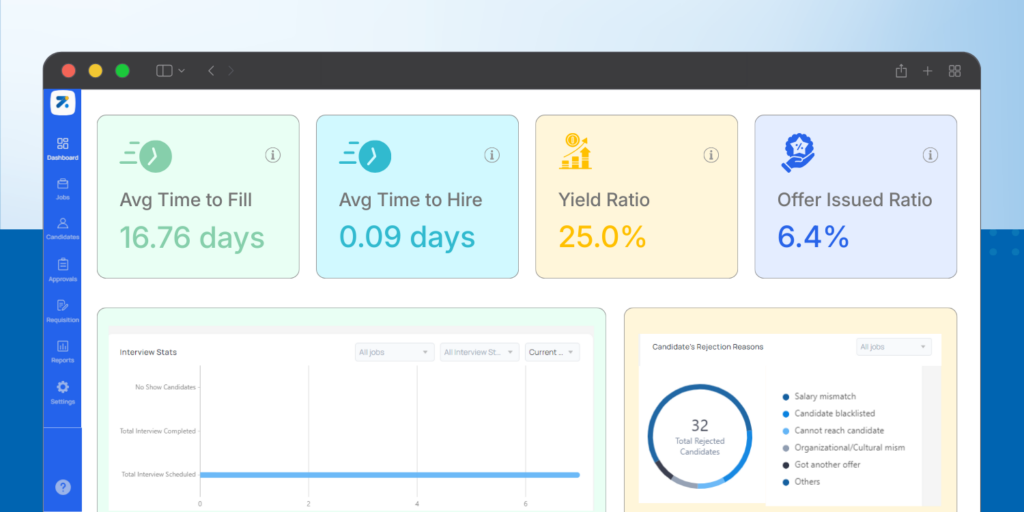
1. Time‑to‑Fill & Time‑to‑Hire
One of the most foundational recruitment reports tracks hiring speed.
Time‑to‑fill tracks the days between posting a requisition and signing an offer, while time‑to‑hire measures the period from a candidate’s first interaction to their acceptance.
Both metrics matter because protracted processes drive up costs and erode candidate trust. Shannon Shaper, former Google Hiring Innovation Manager and Global Head of People Operations Reporting, emphasized streamlining interviews
“We thought that the more Google employees who interviewed a single candidate, the better our hiring decision would be… Four interviews… provided an accurate prediction of a new hire’s performance 86% of the time. Adding more interviewers produced rapidly diminishing returns.”
– Shannon Shaper, former Google Hiring Innovation Manager and Global Head of People Operations Reporting
This change cut Google’s time to hire by about two weeks.
What to Track
- Average time‑to‑fill and time‑to‑hire by role and department
- Interview stages per hire to spot bottlenecks.
- Time in each pipeline stage (sourcing, screening, interviewing, offer) to identify delays.
.
2. Quality‑of‑Hire
Among performance-focused recruitment reports, quality-of-hire (QoH) is the most strategic as it
connects recruiting outcomes to performance and retention.
A survey found that improving quality‑of‑hire is the top priority for 75% of HR and TA leaders, eclipsing traditional metrics like cost‑per‑hire and time‑to‑fill.
Laszlo Bock, former SVP of People Operations at Google, warned on hiring standards.
“A bad hire is toxic, not only destroying their own performance, but also dragging down the performance, morale, and energy of those around them. Only hire people who are better than you… never compromise on a high standard of quality.”
– Laszlo Bock, former SVP of People Operations at Google
LinkedIn’s Future of Recruiting 2025 report adds that 61% of TA professionals believe AI can improve the way quality‑of‑hire is measured and 93% say accurately assessing skills is crucial.
Because performance reviews and retention data are often siloed from recruiting, quality‑of‑hire should incorporate both leading and lagging indicators.
For example, measure first‑year retention, hiring manager satisfaction, and on‑the‑job performance scores. When integrated into your ATS, these metrics reveal whether talent pipelines produce high performers or high turnover.
What to Track
- First‑year retention and early attrition by source, recruiter, and hiring manager.
- Performance ratings of new hires versus internal benchmarks.
- Time‑to‑productivity and manager satisfaction surveys.
- Candidate skills match scores, especially when using AI‑driven assessments.
3. Offer Acceptance Rate
A stellar candidate experience and competitive offers culminate in acceptance rates.
“By paying the market rate, our offer acceptance rate has climbed to 89.7%, and its retention has never been higher.”
– Daniel Barber, CEO of DataGrail
Tracking acceptance rates helps you understand whether compensation, employer brand, or the candidate experience is causing drop‑off.
“Delays between final interview and decision are where you lose your best candidates.”
– Deepu Xavier, Co-founder of Zappyhire
What to Track
- Offer acceptance rate overall and by department
- Reasons for rejection gathered through candidate surveys.
- Time between final interview and offer sign‑off as delays can prompt candidates to accept rival offers.
4. Source‑of‑Hire and Funnel Conversion
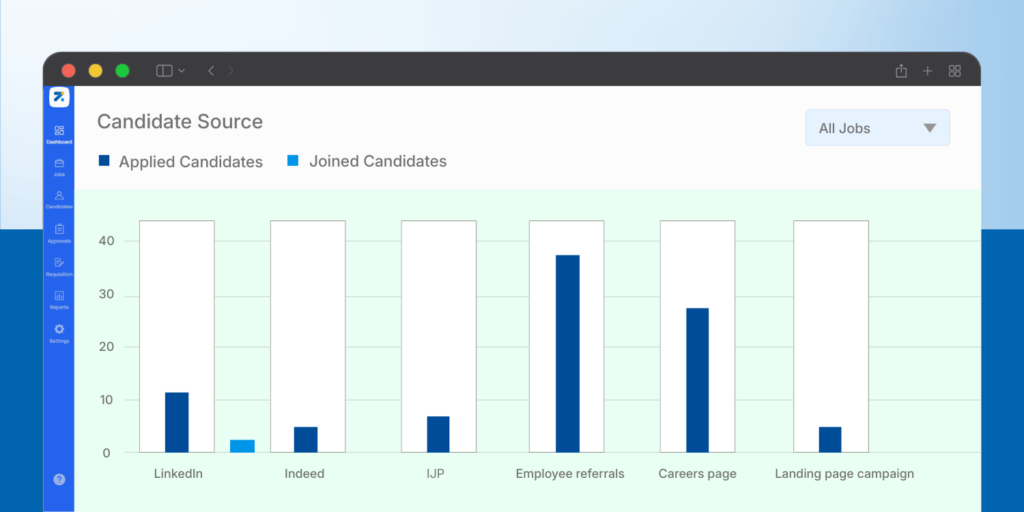
Funnel-based recruitment reports help you understand which channels produce quality candidates allows you to invest resources wisely, as data reveals stark differences between inbound and outbound recruiting.
For inbound applicants, only 6% progress from application to pre‑onsite assessment; 20% of those advance to onsite interviews, and 35% of onsite candidates receive an offer.
Ultimately, the application‑to‑hire rate for inbound candidates is about 0.4%, while outbound candidates are five times more likely to be hired (2% conversion). Such disparities underscore the importance of measuring pass‑through rates at each stage.
What to Track
- Number of applicants, candidates screened, interviews, offers, and hires by source (career site, referrals, job boards, sourcing).
- Pass‑through rates between stages to pinpoint drop‑off points.
- Cost per applicant and per hire by channel to gauge ROI.
5. Candidate Experience Metrics
Candidates today expect transparency and speed, and candidate experience recruitment reports help teams protect employer brand.
A survey based on over 230,000 candidate responses, shows that candidate contentment has declined sharply and resentment has risen to record highs.
“Candidate experience better be at the top of your list when it comes to priorities in your organization. Candidate experience is the new marketing.”
– Steve Cannon, former President of Mercedes-Benz USA
Technology and finance sectors have the highest resentment rates (25% in North America compared with an overall average of 14%). Those who report a poor candidate experience are less likely to apply again, refer others or buy from a consumer‑facing employer. are less likely to apply again, refer others or buy from a consumer‑facing employer.
What to Track
- Candidate Net Promoter Score (NPS) or satisfaction at key stages (application, interview, offer).
- Response times – measure the average time to acknowledge applications and deliver decisions.
- Communication channel usage (email, SMS, chatbots) and conversion.
- Drop‑off reasons gleaned from surveys or exit interviews.
6. Cost‑per‑hire And Budget Efficiency
Recruitment is an investment, and cost‑per‑hire is defined as total internal and external recruiting costs divided by the number of hires.
Using this standard enables apples‑to‑apples comparisons across departments and years.
“Most recruiting effort is spent filtering volume – automation removes that wasted time and cost. It saves teams from spending hours screening candidates who were never a fit.”
– Deepu Xavier, Co-founder of Zapphire
What to Track
- Total recruiting spend (internal staff time, job advertising, agency fees, technology licenses).
- Cost‑per‑hire by role and source to identify expensive channels.
- Cost of vacancy (lost productivity/revenue) to understand the true cost of unfilled roles.
- Budget forecast vs. actual spend to plan future hiring cycles.
7. Diversity, Equity and Inclusion Metrics
Data‑driven recruiters build inclusive teams that fuel innovation. McKinsey’s Diversity Wins study shows that companies in the top quartile for gender diversity are 25% more likely to achieve above‑average profitability.
Meanwhile, BCG’s analysis of companies across eight countries found that organizations with above‑average leadership diversity generate 19 percentage points more innovation revenue (45% vs. 26%) and have EBIT margins 9 percentage points higher than less‑diverse peers.
These correlations clearly show diverse teams not only enhance fairness but also drive financial results.
Tracking diversity metrics requires more than counting heads. Start by examining your talent funnel: how do pass‑through rates differ by gender, ethnicity or other protected characteristics?
What to Track
- Representation at each hiring stage by gender, ethnicity, and other demographics.
- Pass‑through rates (application to screening, interview to offer) by demographic group.
- Retention and promotion rates for underrepresented employees versus overall averages.
- Inclusion survey scores (belonging, respect, psychological safety).
8. Automation And AI Adoption Usage Reports
AI and automation are reshaping recruiting. Research shows that 79.5% of companies are exploring or adopting AI tools, but only 12.8% have fully implemented them.
Measuring automation usage and its impact on efficiency and candidate satisfaction will help you build a stronger business case for modernizing your tech stack.
“AI is turning recruiting from a manual, linear process into a precision discipline where outcomes improve because decisions are data-driven, consistent, and transparent.”
– Stella Ioannidou, Senior Research Director at The Josh Bersin Company
What to Track
- AI adoption rate – percentage of requisitions using AI‑driven matching, sourcing or assessments.
- Recruiter workload reduction (e.g., hours saved per requisition).
- Candidate engagement via chatbots or SMS and resulting NPS.
- Bias monitoring – evaluate AI tools regularly for disparate impacts.

9. High‑volume Hiring and Throughput Metrics
High-volume recruitment reports ensure your hiring process can scale without breaking. And for enterprises filling hundreds or thousands of hourly roles, volume hiring has unique challenges.
Research reveals that 77% of organizations engage in high‑volume recruiting and 60% cite a scarcity of quality candidates as a major obstacle.
Leaders in this space emphasize automation as 65% believe that streamlining processes and removing barriers is most effective.
They also track conversion rates more rigorously: 33% of high‑volume recruiting leaders monitor applicant conversion vs. only 6% of laggards.
These metrics help determine whether your hiring funnel can handle surges in demand without sacrificing candidate experience.
What to Track
- Applicant-to-hire conversion at scale.
- Screening throughput (applications processed per recruiter per day).
- Automated versus manual step ratios to measure efficiency.
- Candidate churn (no‑shows, withdrawals) and root causes.
Turn Data from Recruitment Reports to Action
Research shows that organizations leading on these metrics hire faster, delight candidates, spend less and build more innovative teams.
But metrics alone don’t create change – you need technology that surfaces insights and automates away drudgery.